Sylvia Earle
Interactive Diagram
Select PCO2 units and Submit.
Above 1500 meters (4,920 feet)
Use the High Altitude Diagram.
Sea Level Diagram: Above, enter the Units for PCO2. The Interactive Diagram (Schlichtig R, Grogono AW, and Severinghaus JW) will provide a text explanation3 for every combination of pH and PCO2.
The red and blue radiating zones accurately represent each group. However, a few individuals will lie outside each zone; so, always examine the patient carefully as well!
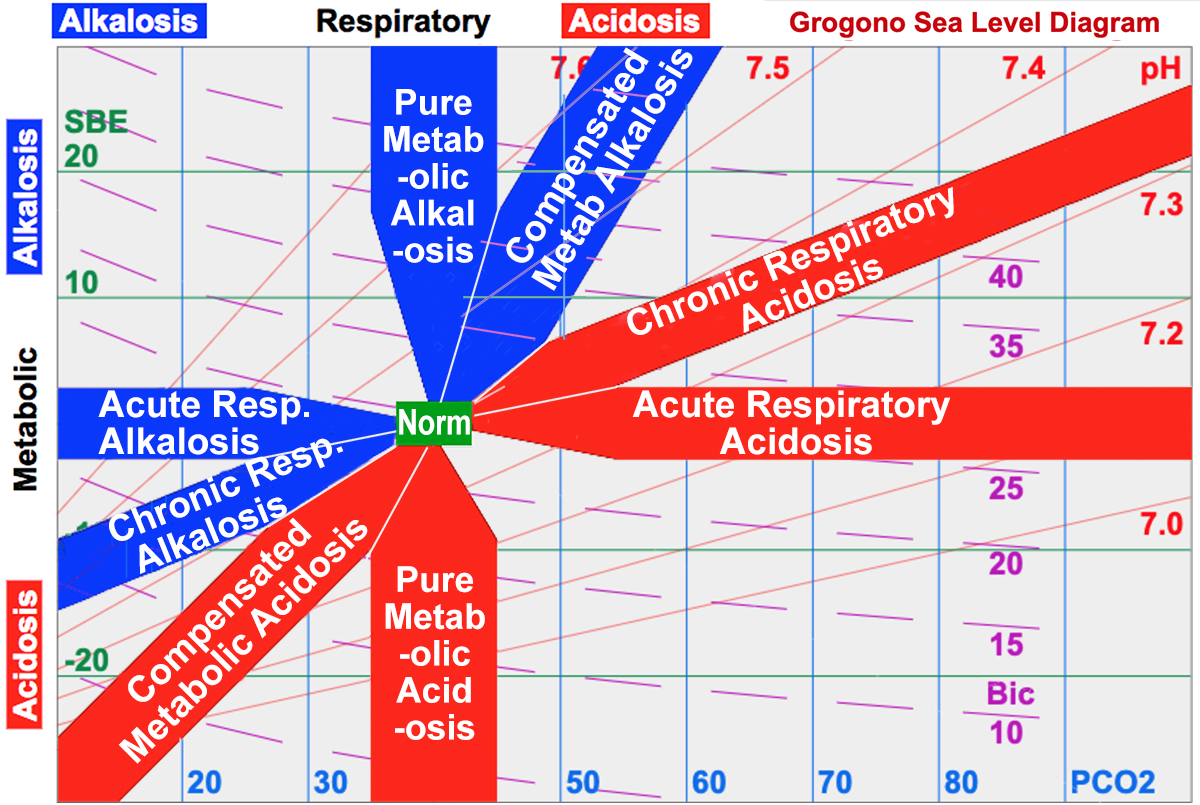
The Two Axes are the Respiratory Component (PCO2) and the Metabolic Component, Standard Base Excess (SBE). Also plotted are the pH and the Bicarbonate but, alone, neither measures the Respiratory nor the Metabolic Component.
High Altitude: For accurate results above 1500 meters (4,920 feet) use the High Altitude Version4.
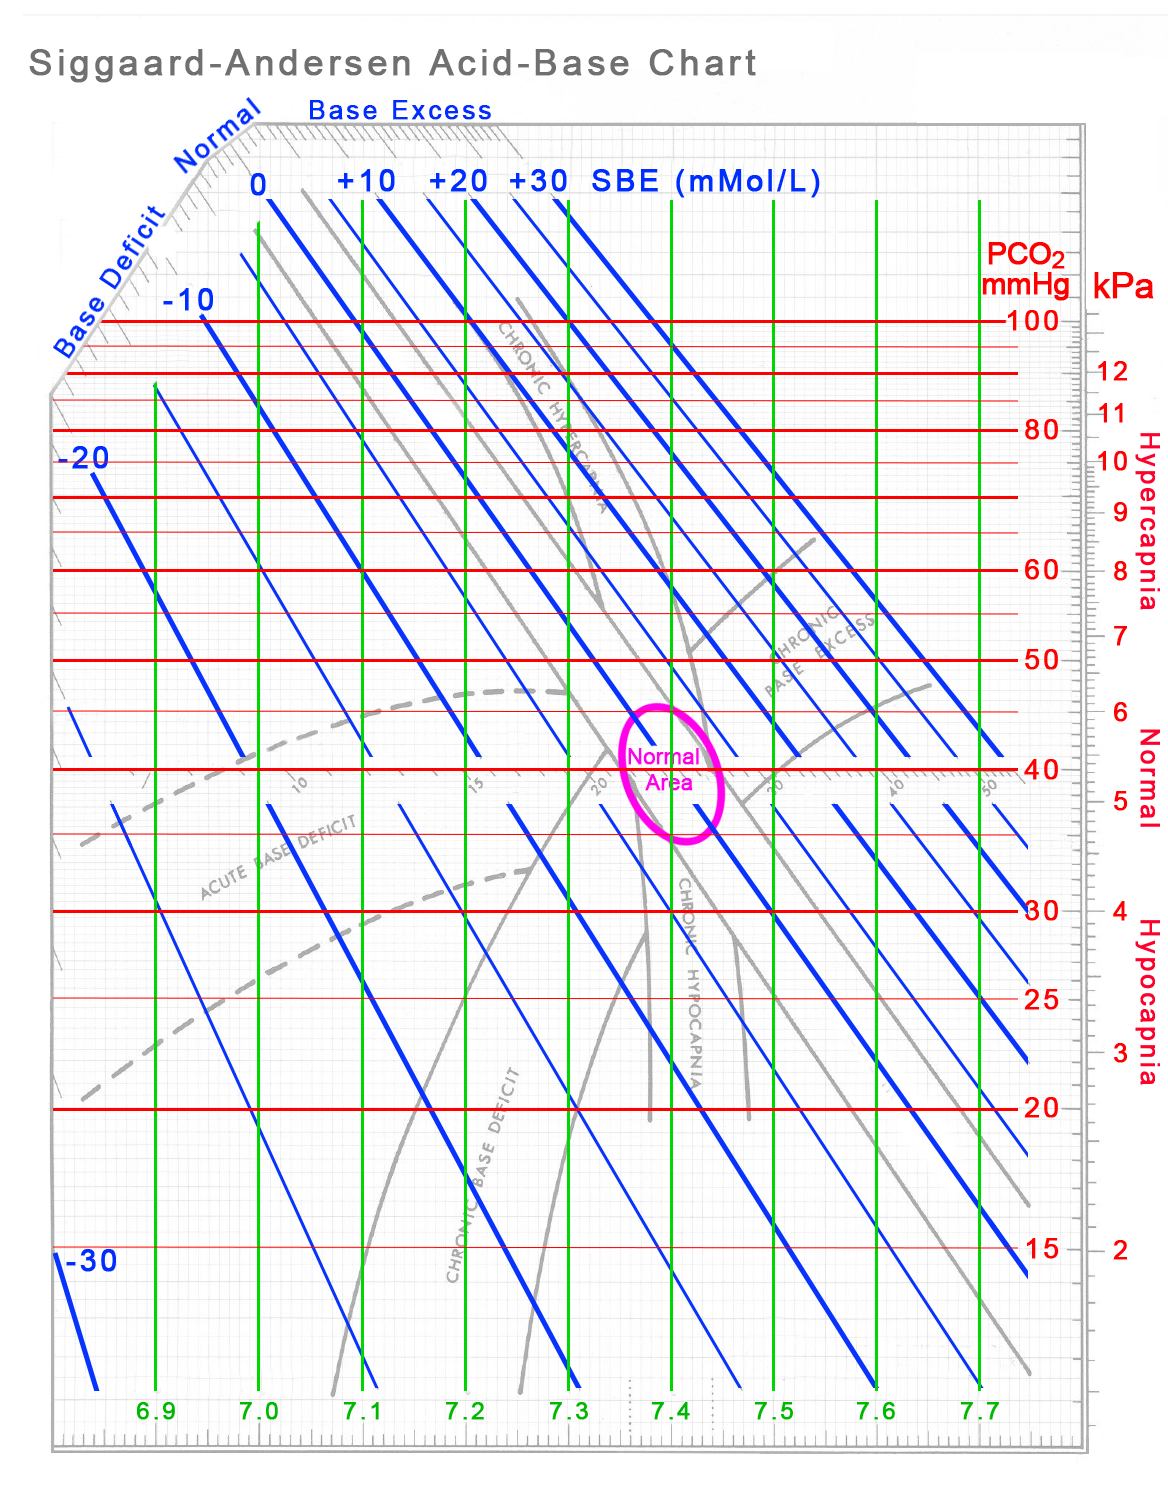
Siggaard-Andersen Diagram
Acid-Base Diagrams: Many diagrams have been devised to represent the relationship between arterial PCO2 and pH. The best known is probably the Siggaard-Andersen Acid-Base Diagram1 (S-A Diagram) shown here with typical zones. However, the axes for the PCO2 and [H+] concentrations are logarithmic, the zones are irregular and curvilinear, and the Lines for Standard Base Excess (SBE) are oblique implying that SBE is dependent on the pH and PCO2 rather than one of the two independent variables controlling the pH.
The S-A Diagram provided the data for the new diagram which uses linear scales for the respiratory and metabolic components. The pH and bicarbonate become oblique dependent variables. These features make the new diagram easier to understand and use.
Typical Zones: The Zones on the new diagram are linear bands derived from a review of over twenty papers carried out by Dr. Robert Schlichtig.2 At higher altitudes the High Altitude Version provides accurate values for PCO2 and Base Excess as well as appropriately located Zones.
Acknowledgement:
The author is grateful to Peter Grogono, B.A., M.A., M.Comp.Sc., Ph.D. (Department of Computer Science and Software Engineering, Concordia University, Montreal, Quebec, Canada) for the introduction to animating diagrams using JavaScript.
References:
1 Siggaard Andersen O and Engel K. “A New Acid-Base Nomogram. An Improved Method for the Calculation of the Relevant Blood Acid-Base Data.” Scandinav. J. Clin. & Investigation 177-186, 12, 1960.
2 Schlichtig R, Grogono AW, Severinghaus JW. “Human PaCO2 and standard base excess compensation for acid-base imbalance.” Critical Care Medicine. 26:1173-1179. 1998.
3 Grogono AW. “Acid–Base Reports Need a Text Explanation” Anesthesiology. 130:668–669. 2019.
4 Grogono AW, Solarte I. “Correcting Acid Base Interpretation for High Altitudes.” Anesthesiology. 134:133–135. 2012.